Bridging Business & Tech
No black box, it is always clear where your decisions are based upon
Co-creation for lasting adoption

Forecasting models have evolved rapidly over the last decade. Classical tools such as ARIMA, exponential smoothing, and state-space models remain essential, but new approaches from machine learning and deep learning have begun to rival—and often outperform—them.
In this blog the forecast quality of the N-BEATS and N-HiTS models is assessed. Although N-BEATS and N-HiTS come from the world of deep learning, they look very different from the complex neural networks often used in image recognition or natural language processing. Those general-purpose models rely on intricate stacks of convolutions, recurrences, attention layers, and other machinery built to process spatial or textual structure. In contrast, N-BEATS and N-HiTS take a much more focused and streamlined approach: they are deep-learning models built specifically for time-series forecasting and nothing else. Their architecture is intentionally simplified—consisting of repeated, modular units rather than elaborate, multi-component pipelines—so that the model can devote its capacity to learning patterns in temporal data rather than handling generic tasks. This specialization makes them easier to understand, easier to train, and often more accurate on forecasting problems than larger, more general deep-learning architectures. In short, they use the strengths of deep learning (flexibility, automatic pattern discovery) while avoiding the complexity that can make neural networks feel like black boxes.
In addition to the comparison between N-BEATS and N-HiTS, a relative simple benchmark model named DLinear is included in the analysis. The three models are described below.
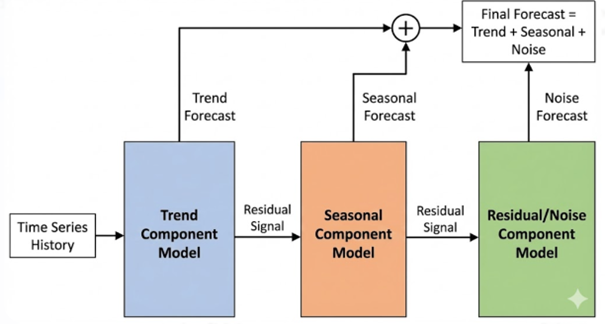
N-BEATS (Oreshkin et al, 2020) can be seen as a sequence of interconnected components, each responsible for analyzing a portion of the historical data and contributing incrementally to the final forecast. Each component first attempts to characterize a specific aspect of the past—for example, a trend, a repeating seasonal cycle, or a slower-moving fluctuation. Once it has extracted this structure, it then adds its own contribution to the prediction of future values. The overall forecast is formed by combining the outputs of all components, with each one refining or complementing the work of the previous ones. The model does not need input on the trend or the seasonal cycle(s), it learns these shapes directly from the data. N-BEATS shows that strong forecasting performance is possible with a transparent, modular design rather than exotic neural network components. The model is illustrated in the figure below.
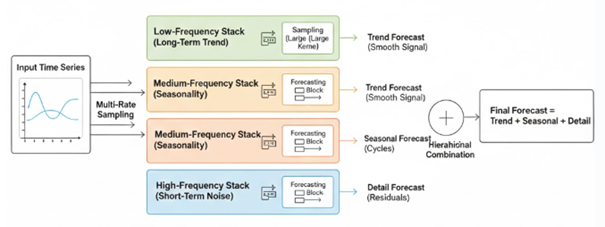
N-HiTS (Challu et al, 2022) builds on the same modular philosophy as N-BEATS but adapts it for situations where the data contain substantial high-frequency variation or long look-back windows. Instead of working at a single level of detail, the model decomposes the forecasting task into multiple temporal resolutions, allowing different components to focus on different scales of the signal. Some components capture broad, slowly evolving structures, while others concentrate on finer-grained fluctuations. These components operate through a hierarchical interpolation mechanism that reconstructs the forecast by combining coarse, medium, and fine-scale contributions. As in N-BEATS, each component provides its own partial forecast, and the final prediction emerges from aggregating their outputs in a way that refines and complements what earlier components have captured. N-HiTS therefore achieves strong performance on complex or noisy data by selectively emphasizing the most informative parts of the input and learning multi-scale patterns directly from the historical series, all within a streamlined architecture tailored specifically for forecasting. The model is illustrated in the figure below.
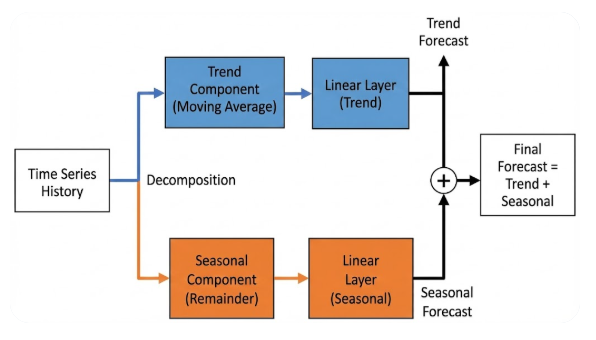
DLinear (Zeng et al, 2022) takes a minimalist approach to forecasting by focusing on the essential components of a time series rather than relying on deep hierarchical architectures. The model begins by separating the historical data into two broad elements: a slowly evolving trend component and a repeating seasonal component. Each of these is then projected forward using a straightforward linear transformation, learned directly from the data. Unlike more complex neural network designs, DLinear does not incorporate nonlinear activations or multi-layer feature extractors; instead, it leverages the idea that many forecasting tasks can be effectively addressed through well-calibrated linear relationships. The resulting forecast is obtained by combining the projected trend and seasonal parts, providing a surprisingly strong baseline with minimal computational overhead. In practice, DLinear demonstrates that performance gains in forecasting often arise from aligning model structure with the underlying data properties rather than from architectural complexity. The model is illustrated in the figure below.
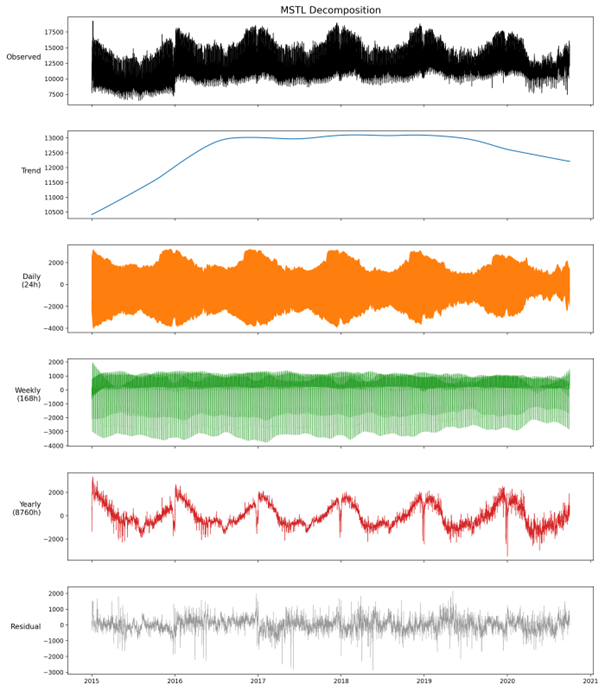
To assess the forecasting quality of the models, a dataset from the Open Power System Data site (https://data.open-power-system-data.org/time_series) is used. The datasets consists of around 50,000 hourly observations of electricity consumption in the Netherlands between Jan-2015 and Oct-2020. The figure below shows the historical time series.
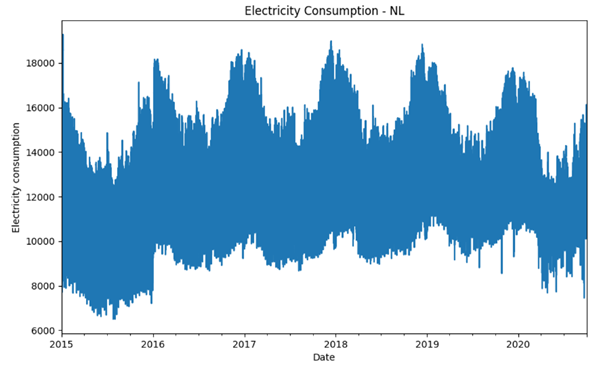
The annual seasonality is clearly visible from the figure. Additionally, daily seasonality and weekly seasonality (weekends) is expected. This is further analyzed using MSTL (Multiple Seasonal-Trend decomposition using LOESS). This is a method for decomposing a time series into trend, remainder, and multiple seasonal components using iterative LOESS smoothing. The results are shown in the figure below.
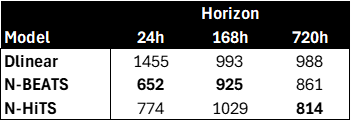
The predictive accuracy of the three models was evaluated using rolling-origin cross-validation. For each forecast horizon, the time series was split into five consecutive evaluation windows, each with length equal to the forecast horizon. For every window, the model was retrained on all data available up to the window’s origin, and forecasts were generated for the corresponding horizon. The Root Mean Squared Error (RMSE) was computed for each window, and the average RMSE across the five windows was used as the cross-validation score. The results are given in the table below for horizons of 24 hours, 168 hours (a week) and 720 hours (a month).
Note that for all three models, calendar covariates (month and day-of-year) are incorporated. While NBEATS and NHITS are capable of discovering annual seasonality directly from the raw time series, supplying explicit calendar features is computationally more efficient. These covariates enable the models to capture long seasonal patterns without expanding the input window to cover a full year, thereby lowering both the computational burden and the memory footprint during training.
The table shows that the N-BEATS performs best for the 24-hour and 168-hour horizon. The model handles non-linear effects and multiple harmonics well on daily and weekly basis. For the monthly horizon, the N-HiTS model performs better. This is in line with expectations, since it includes mechanisms (pooling, smoothing) which reduces noise and focuses on long periodic components, at the expense of the high-frequency dynamics.
The benchmark model DLinear performs the least of the three models overall. However, it is interesting to note that the RMSE decreases for longer horizons. This implies that DLinear only captures the very broad trend and seasonality and fails to capture local short-term fluctuations.
In this blog, the forecasting quality of two deep learning models, N-BEATS and N-HiTS, are compared with a relatively simple benchmark model for a time series of hourly energy consumption in The Netherlands. N-BEATS performs best for daily and weekly horizons, while N-HiTs performs best for a monthly horizon. This is in line with expectations given the structure of these models. In the second part of the three blogs, these models will be compared with a traditional econometric mode, Dynamic Harmonic Regression.
Challu et al. (2022). N-HiTS: Neural Hierarchical Interpolation for Time Series Forecasting.
Oreshkin et al. (2020). N-BEATS: neural basis expansion analysis for interpretable time series forecasting.
Zeng et al. (2022). Are Transformers Effective for Time Series Forecasting?